Some of our clients are looking at ways to gain more information about vegetation health from aerial imagery. We have been preparing NDVI maps that show whether or not a site contains live green vegetation. This is useful in bushfire and planned burn mapping and general vegetation health mapping. Farmers may use NDVI for precision farming and to measure biomass. Foresters use NDVI to measure forest supply and leaf area index. NDVI is also used as a good indicator of drought.
Aerial Photography using our specialised aerial camera captures the traditional Red, Green and Blue visible imagery, as well as a fourth Near Infrared band. Normalized Difference Vegetation Index (NDVI) quantifies vegetation by measuring the difference between near-infrared and red light.
Chlorophyll in plant leaves, strongly absorbs visible light for use in photosynthesis. The cell structure of the leaves, on the other hand, strongly reflects near-infrared light. The more leaves a plant has, the more these wavelengths of light are affected, respectively.
If there is much more reflected radiation in near-infrared wavelengths than in visible wavelengths, then the vegetation in that pixel is likely to be dense. The NDVI ratio gives values between -1 and +1. Pixel values near +1 are healthy vegetation and pixel values near 0 have no vegetation. If the pixel has negative values, it’s highly likely that it’s water.
For the mathematically minded the formulae for NDVI is:

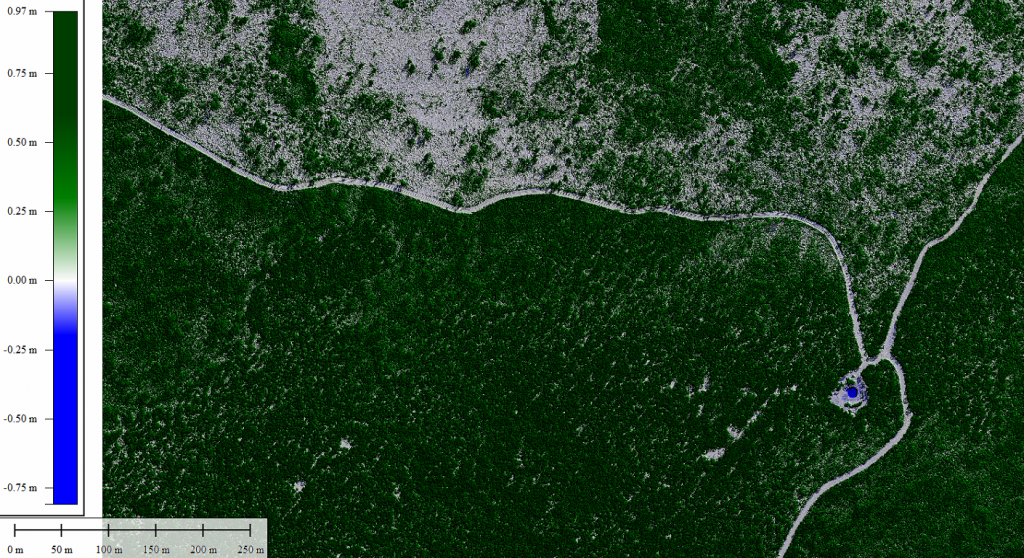
The image below shows a NDVI map for a site after a planned burn (also called prescribed burn or hazard reduction burn). Burnt areas to the north of the track and a small dam on the eastern side are clearly visible.